While the rate of immigration to West Vancouver hasn’t increased over the past five years, it continues to be home to the largest newcomer population on the North Shore, and ahead of the Greater Vancouver average.
According to the latest round of 2021 census data, immigrants made up 45.7 per cent of West Van’s total population. That’s compared to 38.3 per cent in the City of North Vancouver, 32.3 per cent in the District of North Vancouver, and 41.7 per cent in Greater Vancouver.
On the other hand, the rate and total number of new immigrants to West Vancouver over the past five years was flat compared to continued growth across both other North Shore municipalities. While West Van is home to 5,250 new immigrants, 7,155 recently moved to North Van city and 7,145 to North Van district.
Previous census data released this year highlights West Van’s ever-aging demographics, and concentration of high income and inequality. While the district stands out as a deep immigrant community on the North Shore, various complicating factors are mixed in with global migration and wealth, said Andy Yan, director of SFU’s City Program.
“Maybe the story is that West Vancouver is the global suburb,” he said, noting that the history of the district becoming an magnet for worldwide wealth goes back 100 years, “ever since they ripped it off the Squamish (Sḵwx̱wú7mesh).”
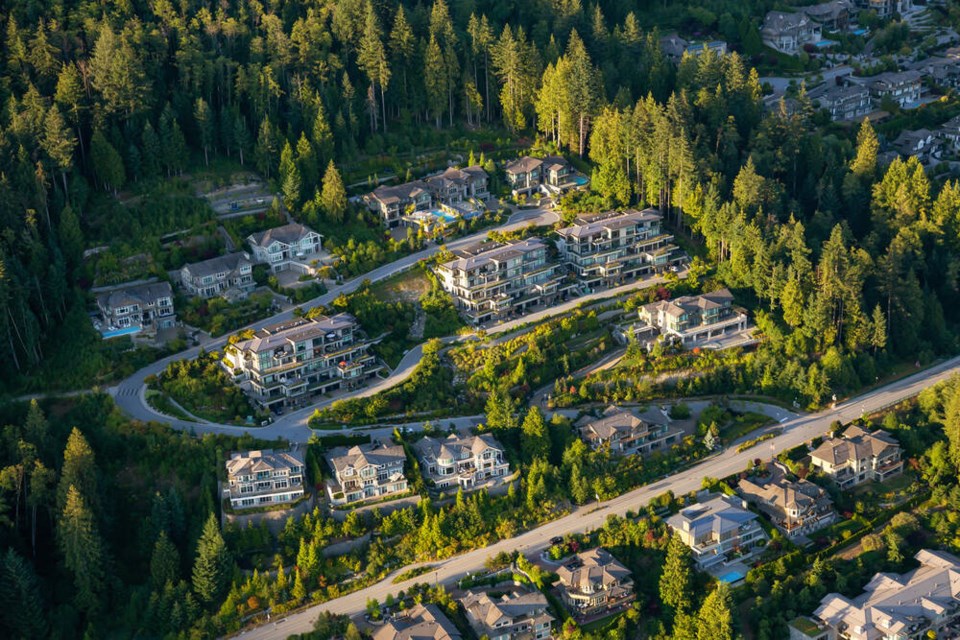
Since the Guinness family bought the British Pacific Properties from the district in 1931, it’s been marketed as a luxury community close to city life, yet still secluded.
“It’s a story of money in Vancouver, and one of the epicentres is the District of West Vancouver,” Yan said. “This is where the issue is: What kind of communities are being created with this kind of wealth?”
He said this is a healthy question for the local democracy to talk about. “Who gets pushed out? Who gets in?” But data is just one part of the story, Yan said.
Majority of North Shore immigrants from China, Iran, U.K., census shows
West Van is home to the North Shore’s highest first-generation cohort at 51.9 per cent of the population (which includes 1,530 non-permanent residents). That’s compared to 43.8 per cent first-generation individuals living in North Van city and 36.9 per cent in North Van district.
In terms of places of birth for West Van’s immigrant population, 63.4 per cent selected Asian countries – with most reporting China (26.7 per cent of total) and Iran (22.2 per cent); another quarter (22.6 per cent) selected European nations; with smaller numbers from the Americas (5.7 per cent) and Africa (4.8 per cent).
In the District of North Vancouver, more than half (51.4 per cent) selected Asian countries – 22.7 per cent Iran, 7 per cent China and 5.6 per cent Philippines; 29.7 per cent reported Europe; with 10.2 per cent from the Americas and 6.4 per cent Africa.
And in the City of North Vancouver, 56.6 per cent selected Asian counties – 22.7 per cent Iran, 7 per cent China and 5.6 per cent Philippines; 26.4 per cent reported Europe; with 9.7 per cent from the Americas and 5.2 per cent Africa.
Across all North Shore municipalities, the European country with the highest number of expats was the United Kingdom.
According to Statistics Canada, more than half (56.3 per cent) of recent immigrants living in Canada were admitted under the “economic” category – selected for their ability to contribute to the country’s economy. That trend is even stronger on the North Shore, with 78.5 of West Van’s immigrants admitted in the economic category, 70.5 in North Van district, and 70 per cent in North Van city.
Conversely, West Van had the smallest refugee population (3.8 per cent), compared to North Van district (6.1 per cent) and city (8.3 per cent).
The City of North Vancouver boasts the highest mobility on the North Shore, with nearly half (48.8 per cent) of residents having a different address than five years ago. That’s compared to a Greater Vancouver five-year mobility average of 45 per cent, with 39.4 per cent in West Van and just 36.4 per cent in the District of North Vancouver.


