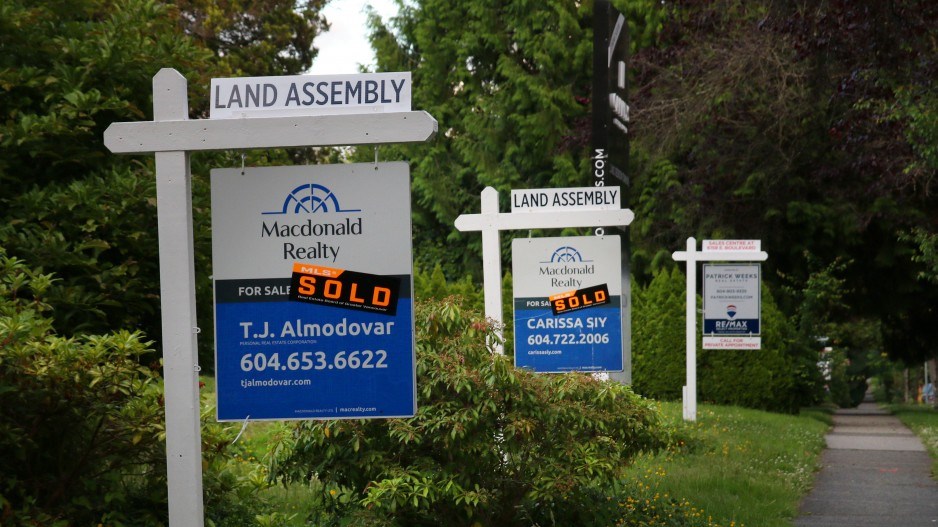
B.C. housing market activity cooled through in August. Higher interest rates curbed housing sales although resale price levels remained high.
Seasonally adjusted Multiple Listing Service home sales dropped to 6,352 transactions during the month, down 10.7 per cent from the previous month following a modest month-to-month decline in July.
August home sales reached their lowest point since April, representing only half the volume observed during the peak in 2021. Affordability remained constrained by higher interest rates, while market uncertainty increased.
During August, significant declines in home sales were observed across major regions of B.C. Transactions retreated 18.5 per cent on Vancouver Island following a steady July gain. Victoria reported 10.8 per cent fewer home sales during the month. In Chilliwack, sales were down 19.9 per cent and the Fraser Valley Real Estate Board area reported a 12.1-per-cent decline. The Greater Vancouver Real Estate Board had its third consecutive monthly decline in August, with 8.5-per-cent lower sales compared with July. B.C. Interior regional home sales also declined by 17 per cent.
Despite fewer transactions, the average B.C. home sale price remained flat at $994,720 (down 0.4 per cent) for a third straight month. Prices were 6.4-per-cent below a peak recorded in February 2022, yet significantly higher – up 35.4 per cent – from the pre-pandemic value recorded in February 2020. Victoria recorded a two-per-cent decline in average price following an eight-per-cent gain in July. In contrast, prices increased in the Fraser Valley (up 0.4 per cent), in Greater Vancouver (up 0.9 per cent) and in the Kootenay (up 0.3 per cent). That said, average prices are influenced by regional and product composition. Adjusting for home attributes, seasonally adjusted benchmark prices were higher in almost all B.C. real estate markets where a benchmark home value is published, but prices increased at a slower rate.
New listings in B.C. decreased 3.2 per cent during the month and paused the growth trend of the past few months. While interest rates are likely at their peak, these elevated levels are expected to continue exerting financial stress on homeowners as mortgage renewals push more owners to the brink.
Lower dollar-volume building permits were issued in B.C. in July. On a seasonally adjusted basis, month-over-month changes were down 24.8 per cent in July when compared to June. They resumed the current trend of lower permit volumes being issued in 2023 compared to 2022. Residential permit volumes fell the most, with a 27.3-per-cent decrease. Non-residential permit volumes declined 20.4 per cent. Year-to-date overall permit volumes fell by 11.4 per cent: Residential permit volumes are down 15.4 per cent and non-residential permit volumes down 7.7 per cent.
Among the census metropolitan areas, Vancouver reversed last month’s gains with a 25.6-per-cent fall, mostly due to a 33.1-per-cent decrease in residential permit volumes for July. Kelowna’s monthly permit volumes were also down 40.6 per cent while Victoria’s permit volumes dropped 44 per cent. On the other hand, Abbotsford-Mission saw building permit volumes increase by 58.8 per cent during the month of July.
Bryan Yu is chief economist at Central 1.


